As business energy consultants, we always have our finger on the pulse, working tireless to help our customers get the best deal on the market. These monthly market reports give you insights directly from our experts. Use our price analysis, market signals, and political changes to help you make the right choice when it comes to your energy.
Download PDFDisclaimer: The information contained in this document has been prepared in good faith by Ginger Energy and provides our views on current/future trends and outcomes, but, as with all forecasts dependent upon multiple, complex variables, there is no certainty whatsoever that our forecasts will turn out to be correct. The information may be based on licenced 3rd party data, publicly available sources, assumptions, and observable market conditions and may change without notice. No warranty, express or implied, is made as to the accuracy, correctness, fitness for purpose, completeness or adequacy of this information nor is it intended to serve as basis for any procurement decision and as such Ginger Energy shall not accept any responsibility or liability for any action taken, financial or otherwise, as a result of this information. Please note that this email is intended for the recipient only and may not be copied, reproduced, or distributed without the prior consent of Ginger Energy.
Market Context
January was a month of two halves in terms of weather. Early on an extreme cold spell swept across Europe but failed to impactthe market as supply and storage remainedrobust. Mild windy weather to end the month kept the market confident that the cold spell would not cause problems and kept bearish pressure present.
- The first half of month witnessed extremely cold temperatures, but supply was robust to meet increased demand.
- The second half of the month temperatures turned well above average with strong winds which significantly reduced demand.
- Despite strong withdrawals early in January, gas storage remains at the higher end of the 5-year average.
- Gas flows from Norway and LNG sendout meant the cold snap was handled comfortably.
- Geopolitical events in the Red Sea failed to impact the market despite the U.S. and UK carrying out air strikes in Yemen in an attempt to deter Houthi’s from creating problems with global trade traveling through the zone.
- News that LNG supplies from the U.S. are to be curtailed as severe cold weather has caused production issues combined with the delay to LNG from Qatar due to Red Sea unrest has so far failed to meaningfully impact the market.
In other news
In Europe it is thought that by 2030 there will be enough LNG capacity to meet all demand despite the fact it is likely to continue to look to pipeline imports from Norway, North Africa, and Azerbaijan to meet the bulk of its gas requirements.
This capacity, as we are witnessing, does provide strong back up to avoid the shocks we saw when Russian pipeline gas was almost entirely cut off.
Seasonal Prices
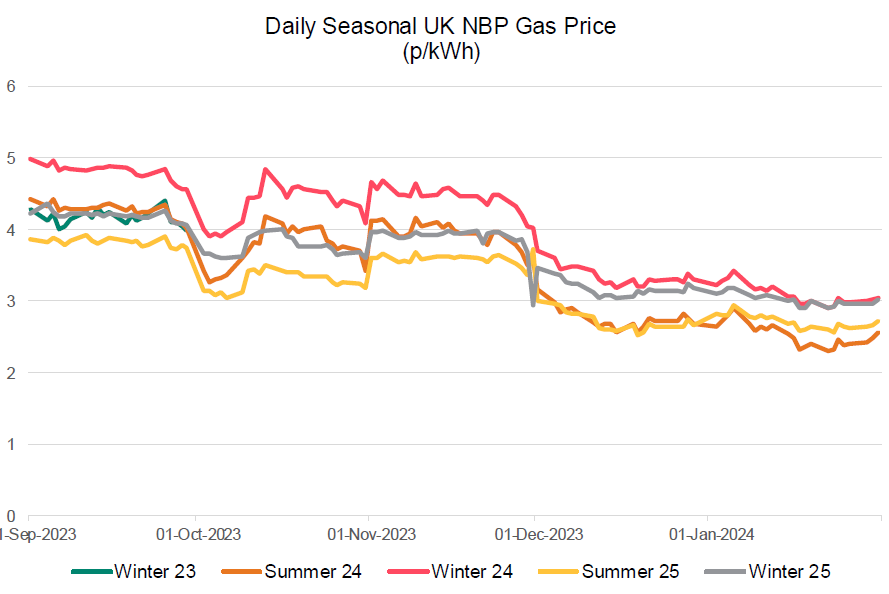
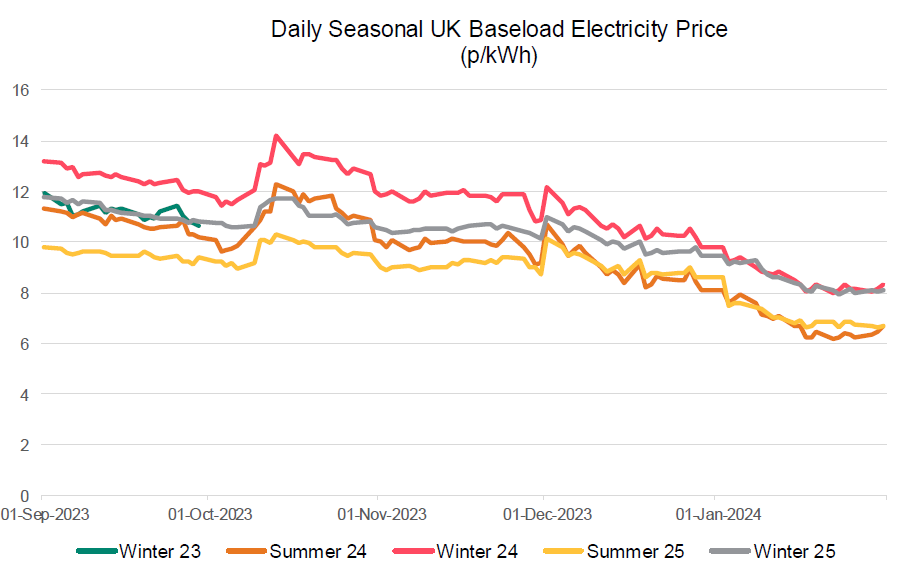
Price Table
During January prices continued to drop despite the cold spell during the early part of the month. Front season prices are now between 30-60% higher than 2019, edging closer to pre-energy crisis levels.
Month End Prices
Spot Prices
| Fuel | Jan-24 (p/kWh) | Dec-23 (p/kWh) | Month-on-Month Difference |
|---|---|---|---|
| Gas (NBP) | 2.55 | 2.68 | -5% |
| Power (UK Baseload) | 6.54 | 5.94 | 10% |
Front Months
| Fuel | Jan-24 (p/kWh) | Dec-23 (p/kWh) | Month-on-Month Difference |
|---|---|---|---|
| Gas (NBP) | 2.56 | 2.95 | -13% |
| Power (UK Baseload) | 6.85 | 8.65 | -21% |
Front Season
| Fuel | Jan-24 (p/kWh) | Dec-23 (p/kWh) | Month-on-Month Difference |
|---|---|---|---|
| Gas (NBP) | 2.56 | 2.76 | -7% |
| Power (UK Baseload) | 6.67 | 7.89 | -15% |
Annual Price (Oct-23)
| Fuel | Jan-24 (p/kWh) | Dec-23 (p/kWh) | Month-on-Month Difference |
|---|---|---|---|
| Gas (NBP) | 2.91 | 3.17 | -8% |
| Power (UK Baseload) | 7.56 | 8.88 | -15% |
Historical Comparison
| Fuel | 2019 Average Front Season Price (p/kWh) | % Increase to Jan-24 |
|---|---|---|
| Gas (NBP) | 1.64 | 56% |
| Power (UK Baseload) | 5.10 | 31% |
Outlook
The weather outlook for the start of February is mild with temperatures currently forecast to return closer to seasonal normal for the later part of the month. There is no expected maintenance to impact flows keeping bearish pressure on the market. However, geopolitical factors still have the potential to create shocks, although in recent weeks the market has been relatively unaffected by the ongoing unrest.
Bearish Signals
- NWE gas storage forecast to be 57% full by the end of Winter-23.
- Norwegian exports on track to hit historical highs with high output expected to continue in January.
- UK Nuclear capacity expected to increase in February as plants come back online.
Bullish Signals
- Continuation/escalation of Red Sea hostilities and conflict in Middle East.
- Unplanned maintenance or outages.
- Lower LNG expected from US as the recent cold spell has impacted production combined with delays to LNG deliveries from Qatar due to Red Sea.
Want the best energy and water contracts for your business?
Ginger Energy can help you.
We take the time to understand your needs and handle everything with the supplier on your behalf. Throughout the entire life on your contract, we’re always on hand to help. And, there’s obligation to stick with us – you contract directly with the supplier, not with you.
Get in touch today to start saving money and time spent on finding the best business energy deals.