As business energy consultants, we are constantly on the lookout for the finest deals on the market for our clients, and we work tirelessly to achieve these. Our monthly market reports provide views directly from our specialists. Use our price analysis, market signals, and political changes to help you make the right choice when it comes to energy decisions.
Download PDFDisclaimer: The information contained in this document has been prepared in good faith by Ginger Energy and provides our views on current/future trends and outcomes, but, as with all forecasts dependent upon multiple, complex variables, there is no certainty whatsoever that our forecasts will turn out to be correct. The information may be based on licenced 3rd party data, publicly available sources, assumptions, and observable market conditions and may change without notice. No warranty, express or implied, is made as to the accuracy, correctness, fitness for purpose, completeness or adequacy of this information nor is it intended to serve as basis for any procurement decision and as such Ginger Energy shall not accept any responsibility or liability for any action taken, financial or otherwise, as a result of this information. Please note that this email is intended for the recipient only and may not be copied, reproduced, or distributed without the prior consent of Ginger Energy.
Market Context
In January prices moved up violently due to a confluence of factors. Cold weather in Europe, the U.S., and Asia caused concern for supply and increased competition for LNG. U.S. foreign policy continued to dramatically influence market movement as stories unfolded relating to Venezuela, Greenland, and Iran. Front Month gas prices rose over 40% through the month and Front Season prices over 20% before receding marginally by the start of February.
- Cold weather forecasts for Europe, the U.S., and Asia combined with low European storage (41%) and heavy withdrawals pushed Front Month gas prices to their highest levels in almost 12-months, rising over 40% over the month.
- Subzero temperatures in the U.S. caused concern for LNG exports. Increased domestic demand combined with fears that infrastructure outages could occur due to freezing conditions worried European markets who are heavily reliant on U.S. LNG due to low storage levels and cold weather.
- The U.S. removed the Venezuelan leader Nicolas Maduro on narco-terrorism grounds and seized control of oil infrastructure in a bid to increase exports from the oil rich country.
- Towards the end of January, trilateral peace talks between Russia, Ukraine, and the U.S. took place in Abu Dhabi attempting to bring an end to the war. No obvious progress was shared and meanwhile Russia continues attacks on civilian energy infrastructure in Ukraine during a bout of freezing weather conditions. Although a brief hiatus was observed on the final weekend of the month to “create favourable conditions” for the peace talks.
- The U.S. signaled intent to takeover Greenland and proceeded to threaten trade tariffs on European NATO allies who opposed their ambitions. The U.S. have since reined back the military rhetoric but still intend to seize the landmass via negotiations.
- The U.S. sent a navy fleet to the gulf to pressure Iran into making a nuclear deal for which negotiations are ongoing. Throughout the month, there has been domestic unrest as protests opposing the current regime were heavily handled by the Iranian government with 1000’s estimated to have been killed.
- A large nuclear outage in France exacerbated the tight supply situation as more gas was required to generate power.
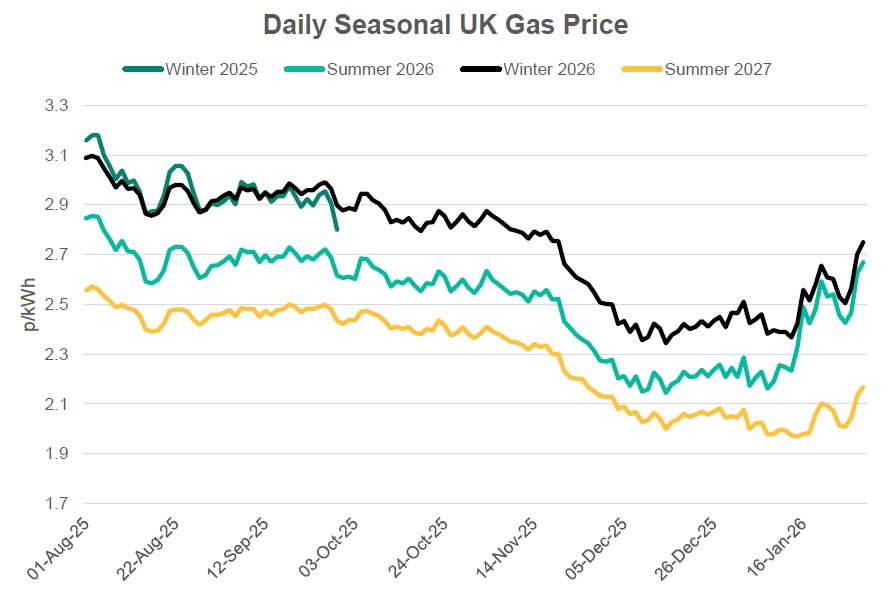
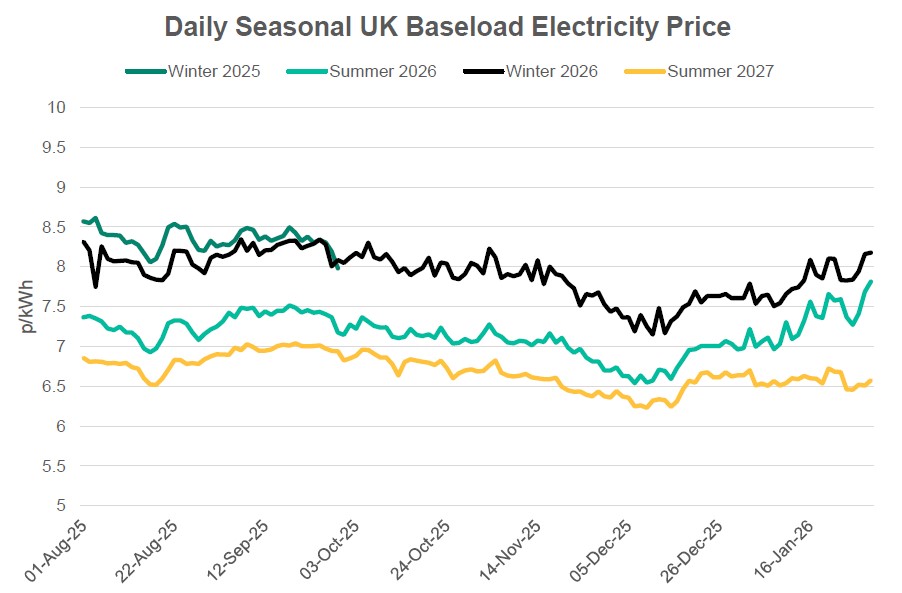
Seasonal Prices
Price Table
Sharp increases were apparent across the curve through January with nearer-term prices feeling the most impact. Cold weather, low storage, and geopolitical events drove prices up as Front Month gas prices ended January higher than they have been since February 25.
Month End Energy Only Prices
Spot Prices
| Fuel | January-26 (p/kWh) | December-25 (p/kWh) | Month-on-Month Difference |
|---|---|---|---|
| Gas (NBP) | 3.06 | 2.43 | 26% |
| Power (UK Baseload) | 9.60 | 7.35 | 53% |
Front Months
| Fuel | January-26 (p/kWh) | December-25 (p/kWh) | Month-on-Month Difference |
|---|---|---|---|
| Gas (NBP) | 3.55 | 2.59 | 37% |
| Power (UK Baseload) | 10.59 | 8.41 | 26% |
Front Season
| Fuel | January-26 (p/kWh) | December-25 (p/kWh) | Month-on-Month Difference |
|---|---|---|---|
| Gas (NBP) | 2.67 | 2.25 | 19% |
| Power (UK Baseload) | 7.81 | 6.96 | 12% |
Annual Price (Apr-26)
| Fuel | January-26 (p/kWh) | December-25 (p/kWh) | Month-on-Month Difference |
|---|---|---|---|
| Gas (NBP) | 2.73 | 2.40 | 14% |
| Power (UK Baseload) | 8.01 | 7.32 | 10% |
Outlook
With EU gas storage currently at just over 40% versus a 5-year average of 59%, markets will continue to be on edge over the coming months making volatility likely. Further cold spells will accelerate withdrawals and put pressure on summer prices as refilling will become a key focus. Continued high flows of LNG from the U.S. are crucial as we move into the back end of winter with any disruption likely to cause a strong bullish reaction. As has been the case for a while now, geopolitical developments have the potential to push markets in both direction with potential peace in Ukraine back on the table as tensions rise again in the Middle East.
Bearish Signals
- First trilateral peace negations between Ukraine, Russia, and the U.S.
- Short and longer-term weather forecast have been adjusted up.
- Expected return of two nuclear generation sites in France after they were disconnected due to storm Goretti.
Bullish Signals
- The return of unrest in the Middle East as the U.S. and Iran enter nuclear negotiations.
- Possible LNG supply issues due to outages or transportation disruption.
- Unexpected cold snaps would see already low EU storage depleted at an accelerated rate.
Want the best energy and water contracts for your business?
Get in touch today to start saving money and time spent on finding the best business energy deals.