As business energy consultants, we are constantly on the lookout for the finest deals on the market for our clients, and we work tirelessly to achieve these. Our monthly market reports provide views directly from our specialists. Use our price analysis, market signals, and political changes to help you make the right choice when it comes to energy decisions.
Download PDFDisclaimer: The information contained in this document has been prepared in good faith by Ginger Energy and provides our views on current/future trends and outcomes, but, as with all forecasts dependent upon multiple, complex variables, there is no certainty whatsoever that our forecasts will turn out to be correct. The information may be based on licenced 3rd party data, publicly available sources, assumptions, and observable market conditions and may change without notice. No warranty, express or implied, is made as to the accuracy, correctness, fitness for purpose, completeness or adequacy of this information nor is it intended to serve as basis for any procurement decision and as such Ginger Energy shall not accept any responsibility or liability for any action taken, financial or otherwise, as a result of this information. Please note that this email is intended for the recipient only and may not be copied, reproduced, or distributed without the prior consent of Ginger Energy.
Market Context
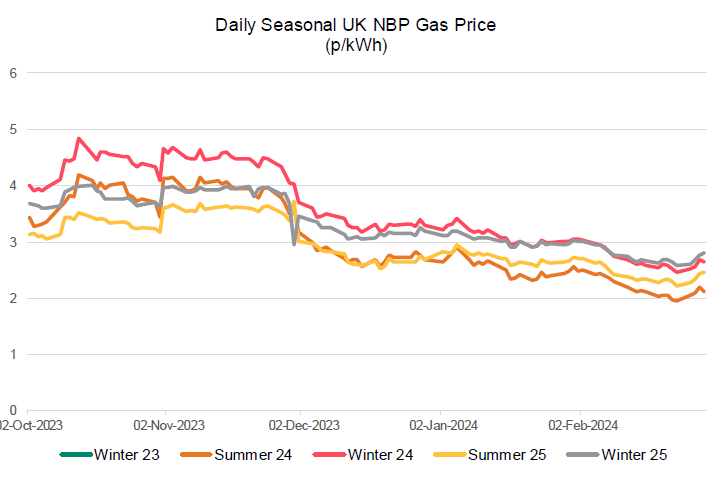
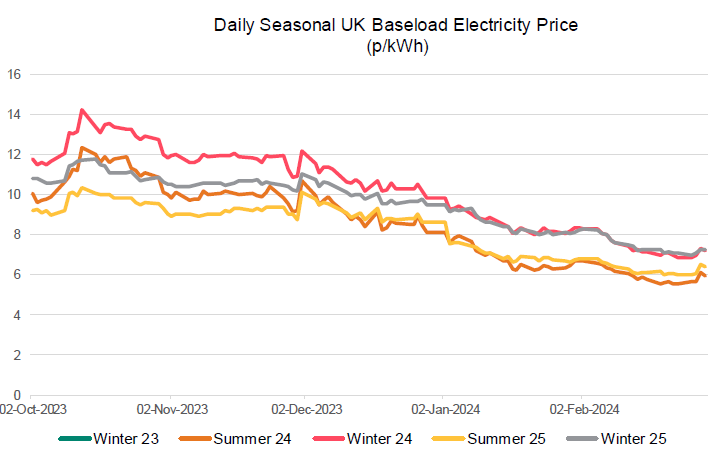
Mild weather across the month kept demand subdued which in turn helped push prices to new lows not seen since the energy crisis started. Tensions in the Middle East continue to have little to no impact on the market with the positive fundamental outlook driving price direction as we edge towards the end of winter.
- The warmest February on record for England and Wales meant demand was low across the month.
- EU gas storage ended the month at an impressively high 61%.
- Houthi backed rebels continue to attack ships and retaliatory and preventative air strikes from the UK and US failed to ratchet up geopolitical risk in the market.
- Small supply side disruptions including lower LNG due to maintenance also failed to add any significant bullish pressure.
- The last week of the month witnessed a small upward price correction as markets tested the lows seen earlier in the month..
- Denmark and Sweden both concluded their investigation into the damage of the Nord Stream gas pipelines which run from Russia to Germany. Both determined that it was intentional sabotage but failed to go as far as naming the culprit. Information was handed over to German authorities to conclude the investigations.
In other news
The April ‘24 price cap was announced with typical unit rates for gas around 6.04p/kWh and 24.5 p/kWh for electricity. Typical standing charges for gas will be 31.43p/day and for electricity 60.10p/day. These changes will result in a drop of around £240 a year for a typical household.
With the market seemingly stabilising many domestic suppliers are now starting to offer fixed tariffs below the price cap once again.
Seasonal Prices
Price Table
February saw prices across the board decrease further. Lows were witnessed around 23rd before a small upward correction. Front season prices continue to edge closer to pre-energy crisis levels demonstrating the overwhelmingly positive fundamental outlook we are current seeing.
Month End Prices
Spot Prices
| Fuel | Feb-24 (p/kWh) | Jan-24 (p/kWh) | Month-on-Month Difference |
|---|---|---|---|
| Gas (NBP) | 2.15 | 2.55 | -16% |
| Power (UK Baseload) | 6.33 | 6.54 | -3% |
Front Months
| Fuel | Feb-24 (p/kWh) | Jan-24 (p/kWh) | Month-on-Month Difference |
|---|---|---|---|
| Gas (NBP) | 2.13 | 2.56 | -9% |
| Power (UK Baseload) | 5.95 | 6.85 | -13% |
Front Season
| Fuel | Feb-24 (p/kWh) | Jan-24 (p/kWh) | Month-on-Month Difference |
|---|---|---|---|
| Gas (NBP) | 2.12 | 2.56 | -17% |
| Power (UK Baseload) | 5.91 | 6.67 | -11% |
Annual Price (Oct-23)
| Fuel | Feb-24 (p/kWh) | Jan-24 (p/kWh) | Month-on-Month Difference |
|---|---|---|---|
| Gas (NBP) | 2.49 | 2.91 | -14% |
| Power (UK Baseload) | 6.61 | 7.56 | -13% |
Historical Comparison
| Fuel | 2019 Average Front Season Price (p/kWh) | % Increase to Feb-24 |
|---|---|---|
| Gas (NBP) | 1.64 | 30% |
| Power (UK Baseload) | 5.10 | 16% |
Outlook
Despite the continuing unrest in the Middle East and the underlying potential for further escalation, the positive fundamental outlook is set to continue to drive the market. Barring any widespread unexpected outages and dramatic shifts in weather forecast the end of winter should be navigated with very little cause for bullish price movement.
Bearish Signals
- NWE gas storage forecast to be 54% full by the end of March, just below record highs from 2020.
- Strong Norwegian and UK production with solid LNG supply.
- Demand destruction across heating demand and industrial sectors continue.
Bullish Signals
- Continuing geopolitical risk of regional escalation in Middle East and Red Sea.
- Risk of unplanned maintenance or outages.
- Potential for temperature forecast to be revised lower for the remainder of Winter.
- Lower price environment could lead to increased demand which would push prices up.
Want the best energy and water contracts for your business?
Ginger Energy can help you.
We take the time to understand your needs and handle everything with the supplier on your behalf. Throughout the entire life on your contract, we’re always on hand to help. And, there’s obligation to stick with us – you contract directly with the supplier, not with you.
Get in touch today to start saving money and time spent on finding the best business energy deals.